AI Agent Ops - Monitoring Dashboard Template
An AI agent operations dashboard for monitoring requests, token usage, cost, latency, and error rates across models, with API key management built in.
AI Agent Ops Dashboard Template Built with shadcn/ui
AI Agent Ops is a monitoring dashboard designed for teams running AI agents and LLM-powered products in production. Built using Next.js, React, Tailwind CSS, TypeScript, and shadcn/ui + Base UI, it provides request, token, and cost metrics, usage and latency analytics, and API key management out of the box, so you can track model performance without building the dashboard from scratch.
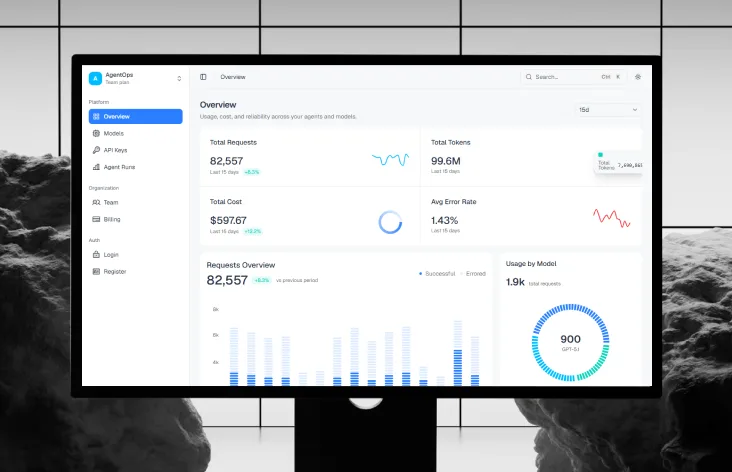
Track total requests, tokens, cost, and average error rate at a glance.
Charts for requests overview, usage by model, and latency & error-rate trends.
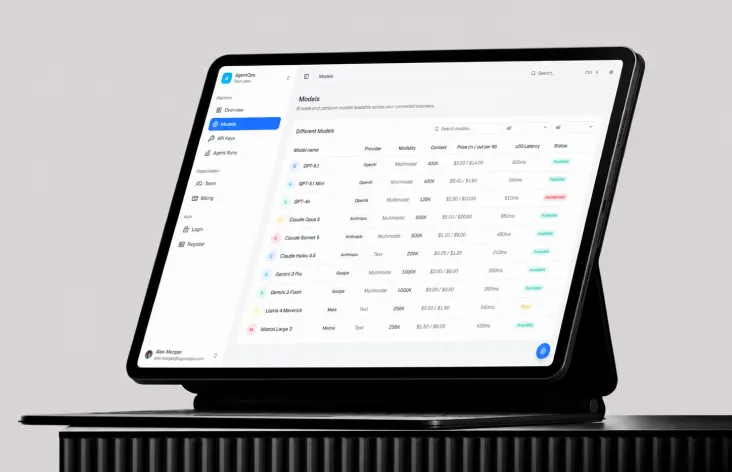
A breakdown of deployed models with request counts and status indicators.
A table for created keys with spend tracking, limits, and active/revoked status.
Collapsible navigation with quick search for fast access across the dashboard.
Model Catalog & Run Tracing
Beyond the top-level metrics, the dashboard drills down into the models you run and the individual executions behind them:
Provider, modality, context window, per-million-token pricing, and p50 latency laid out side by side for every connected model.
Each model is flagged available, deprecated, or beta, so teams know what's safe to route production traffic to.
A searchable table of individual executions, showing the agent, model used, duration, token count, and cost for each run.
Running, success, error, and timeout states are called out per row, making slow or failing runs easy to spot and debug.
Team & Billing Management
Account-level screens round out the dashboard, so it covers more than just usage charts:
Invite teammates as owner, admin, member, or billing-only, with per-member status and join date.
Current plan, monthly price, and seats used versus available, visible at a glance.
A remaining credit balance with an auto-recharge toggle and one-click top-ups.
Past invoices listed with period, amount, and status: paid, pending, or failed.
Modern Technology Stack
Built with the tools that developers love and startup teams trust:
For modern, scalable applications
For utility-first and maintainable styling
For type-safe development and better maintainability
For accessible, reusable, and consistent UI components
Tech Stack
Highlights
- Real-time metrics cards for requests, tokens, cost, and error rate
- Usage-by-model and latency & error-rate analytics charts
- Active models table and API key management table
- Sidebar navigation with command palette and quick search
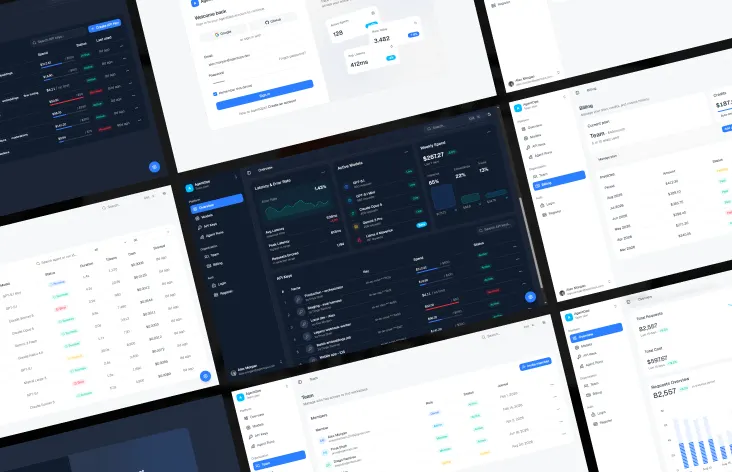
- Fully responsive layout with light & dark mode